
Neighborhood and Built Environment
Introduction
Neighborhood and built environment explores the connection between the environment where a person lives and their health, quality of life, and opportunities to make healthy choices. The context in which residents live profoundly impacts all aspects of their health.
Throughout Mesa County, there are a variety of institutions and services that support and improve residents’ environmental context. These include grocery stores, libraries, parks and green spaces, fire and emergency services, and law enforcement.
These resources improve resident opportunities for healthy choices, capability to meet their basic needs, and safety from potential hazards. The challenge is to provide equitable access to all county residents.
Neighborhood Services and Resources
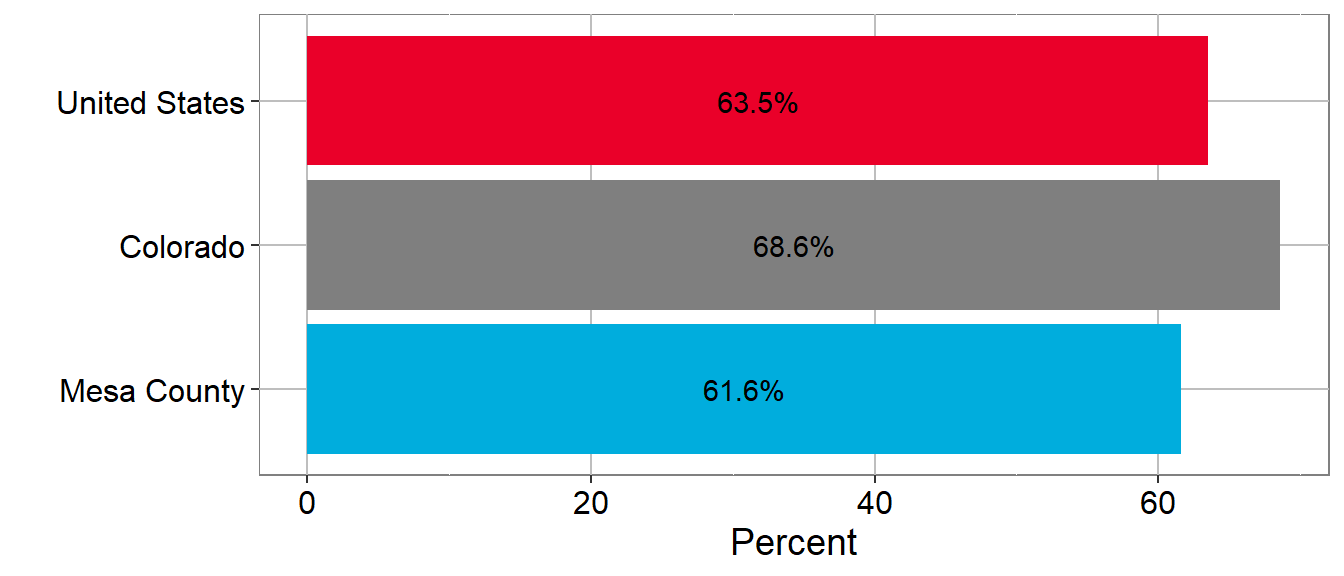
In the 2022 Tell Us Community Survey, residents provided feedback on their satisfaction with access to services and resources in their neighborhoods. 62% of Mesa County residents indicated that Mesa County is a good place to live, but for many residents their satisfaction with their community is heavily impacted by their access to services and resources.
AGREEMENT WITH: MESA COUNTY IS A GOOD PLACE TO LIVE
AGREEMENT WITH: MESA COUNTY IS A GOOD PLACE TO LIVE
| Agree | |
|---|---|
| All Others | 64.3 |
| Redlands | 67.0 |
| Grand Junction | 64.7 |
| Fruitvale | 52.1 |
| Fruita | 59.7 |
| Clifton | 47.0 |
| Overall | 62.3 |
Source: Mesa County Tell Us Community Survey, 2022
MESA COUNTY IS A GOOD PLACE TO LIVE.

Source: Mesa County Tell Us Community Survey, 2022
County-wide, respondent satisfaction with neighborhood services and resources widely varied from consistent satisfaction with the number and quality of parks and trails to deep dissatisfaction with the availability of affordable housing. Unsurprisingly, satisfaction with access to these services and resources correlated with how satisfied residents were with their neighborhoods overall, but that connection was far greater among lower-income residents.
SATISFIED WITH MESA COUNTY NEIGHBORHOOD SERVICES AND RESOURCES (2022)
Basic Conditions
SATISFIED WITH MESA COUNTY NEIGHBORHOOD SERVICES AND RESOURCES (2022)
Basic Conditions
| Amenity | Percent Satisfactied |
|---|---|
| Grocery Store Access | 59% |
| Quality Health Care Access | 49% |
| Overall Safety and Security | 47% |
| Quality Child Care Access | 17% |
| Affordable Housing Availability | 11% |
Source: Mesa County Tell Us Community Survey, 2022
SATISFIED WITH MESA COUNTY NEIGHBORHOOD SERVICES AND RESOURCES (2022)
Transportation

SATISFIED WITH MESA COUNTY NEIGHBORHOOD SERVICES AND RESOURCES (2022)
Transportation
| Tranportation | Percent Satisfactied |
|---|---|
| Bikeability | 49% |
| Walkability | 44% |
| Road Conditions | 28% |
Source: Mesa County Tell Us Community Survey, 2022
SATISFIED WITH MESA COUNTY NEIGHBORHOOD SERVICES AND RESOURCES (2022)
Parks and Trails

SATISFIED WITH MESA COUNTY NEIGHBORHOOD SERVICES AND RESOURCES (2022)
Parks and Trails
| Tranportation | Percent Satisfactied |
|---|---|
| Number of Parks and Trails | 66% |
| Quality of Parks and Trails | 66% |
Source: Mesa County Tell Us Community Survey, 2022
Unsurprisingly, satisfaction with access to these amenities correlated with how satisfied residents were with their neighborhoods overall, but that connection was far greater among lower-income residents.
 Proximity and Income
Low-income residents need access to amenities and resources to feel satisfied with their neighborhood and quality of life.
We considered the relationship between a respondent’s satisfaction with nearby services and resources and their satisfaction with their neighborhood. Proximity to neighborhood services and resources has a stronger impact on respondents’ rating of their neighborhood if they earn less than $50,000 in annual household income than if they earn more than $50,000.
Location is less of a barrier to accessing services and resources for residents with higher incomes. If their neighborhood lacks a service or resource, they can usually drive to access it in a nearby neighborhood. However, location can pose a significant barrier for low-income residents who lack the transportation or flexibility in work schedules to access services and resources that are located farther away.
Percent of Residents who like their neighborhood base on income and satisfaction with conditions (2022)
| When Income < 50K |
When Income > 50K |
|
|---|---|---|
| When Satisfied with Resources and Amenities | 75% | 82% |
| When not Satisfied with Resources and Amenities | 47% | 68% |
| Difference When Satisfied vs When Not Satisfied | 32% | 14% |
Source: Mesa County Tell Us Community Survey, 2022
Rural and Urban Areas
Population Distribution
| Region | Population | Percent |
|---|---|---|
| Grand Junction Urban | 136,674 | 87.5% |
| Mesa county Rural, Rural | 19,457 | 12.5% |
Source: U.S. Census Bureau, American Community Survey 5-year estimates, Table: S0101; AGE AND SEX 2023
Urban & Rural
Various definitions of rural and urban exist. The USDA and Census use different definitions. In general the USDA defines Rural as one that has a population not in excess of 2,500 inhabitants or has a population in excess of 2,500 but not in excess of 10,000 if it is rural in character. The Census defines Urban meeting meets a minimum housing unit density and/or population density requirement, 2,000 housing units or have a population of at least 5,000 within a settled core of census blocks.
Seven in eight Mesa County residents live in an urban area, and one in eight live in a rural area. In general there are fewer services in rural areas. This includes less access to grocery stores, fewer medical services, and longer response time for emergency services. This necessitates higher transportation needs for daily living. Nevertheless, people who live in rural areas of the county have a higher level of satisfaction with their neighborhoods. 82% of rural residents were satisfied compared to 67% of urban residents.
Census defined Grand Junction Urban Area

For many residents, the rural character of a region may be more important than population density. Some people who live between Clifton and Palisade or some areas north of I-70 might be surprised to find themselves designated as urban by the Census.
Official definitions of urban and rural are important for some support programs and funding decisions. Recently, Clifton was re-designated from rural to urban by the USDA, impacting eligibility for funding such as USDA housing programs that target rural areas. Fruita’s designation is also under review based on the rural character of the community, which would potentially open new funding opportunities. (2023 Rural Area Review Notices, p. 8)
Housing
Housing impacts many aspects of life and health including safety, stability, and social connection. Nearly a third of all households pay 30% or more of their income for housing, a cost burden that can limit families’ ability to direct resources to other essential expenses.
Historically, this problem has most affected lower income households, but now the problem impacts households with average and higher incomes, as well. In the 2022 Tell Us Community Survey, only 11% of residents indicated that they were satisfied with the availability of affordable housing.
Housing Cost Trends
The cost of purchasing a home in Mesa County has increased significantly in recent years. Combined with recent high mortgage interest rates, this means purchasing a starter home is currently the most challenging it has been since the 1980s.
Monthly rental costs have also increased notably, although less than starter home costs. However, the median income for the Grand Junction urban area has not kept pace with the housing cost increases. This means the cost of housing has become a burden for an increasing share of Mesa County households.
The biggest change in starter home prices took place in 2022. Annual increases in starter house price have outpaced increases in median income every year since 2016. Annual increases in rent cost have been higher than increases in median income in five out of seven years.
Housing Costs and Income
Increase in Housing Costs and Median Income in Mesa County from 2015 to 2022
- Starter Home Purchase Price - 96% increase
- Monthly Rent - 68% increase
- Median Income - 38% increase
Housing Costs prices.
January Housing Costs
| Year | Typical Starter House | Typical Monthly Rental |
|---|---|---|
| 2015 | $131,542 | $1,065 |
| 2016 | $139,960 | $1,098 |
| 2017 | $148,427 | $1,110 |
| 2018 | $161,275 | $1,202 |
| 2019 | $176,754 | $1,284 |
| 2020 | $194,567 | $1,354 |
| 2021 | $217,199 | $1,439 |
| 2022 | $258,238 | $1,679 |
| 2023 | $276,904 | $1,787 |
Percent Increase since 2015 of Housing Costs and Median Income, Mesa County

Percent Increase since 2015 of Housing Costs and Median Income, Mesa County
Warning: Values from `relative` are not uniquely identified; output will contain
list-cols.
• Use `values_fn = list` to suppress this warning.
• Use `values_fn = {summary_fun}` to summarise duplicates.
• Use the following dplyr code to identify duplicates.
  {data} |>
  dplyr::summarise(n = dplyr::n(), .by = c(name, Year)) |>
dplyr::filter(n > 1L)| 2015 | 2016 | 2017 | 2018 | 2019 | 2020 | 2021 | 2022 | 2023 | |
|---|---|---|---|---|---|---|---|---|---|
| Typical Starter House | 0.0% | 6.0% | 13.0% | 23.0% | 34.0% | 48.0% | 65.0% | 96.0% | 111.0% |
| Typical Monthly Rental | 0.0% | 3.0% | 4.0% | 13.0% | 21.0% | 27.0% | 35.0% | 58.0% | 68.0% |
| Median Income | 0.0% | 2.0% | 5.0% | 9.0% | 12.0% | 16.0% | 26.0% | 38.0% | 45.0%, NA% |
Source: Zillow, Cost Of Housing Trends,
U.S. Census Bureau, American Community Survey 5-year estimates, Table: DP03; SELECTED ECONOMIC CHARACTERISTICS 2023
The biggest change in home prices took place in 2022, but annual increases in starter house price have outpaced increases in median income every year since 2016, and annual increases in rent cost have been higher than increases in median income in five out of seven years.
Yearly Percent Change of Housing Costs and Median Income, January Year over Year Percent Change
Yearly Percent Change of Housing Costs and Median Income, January Year over Year Percent Change
Warning: Values from `change` are not uniquely identified; output will contain
list-cols.
• Use `values_fn = list` to suppress this warning.
• Use `values_fn = {summary_fun}` to summarise duplicates.
• Use the following dplyr code to identify duplicates.
  {data} |>
  dplyr::summarise(n = dplyr::n(), .by = c(name, Year)) |>
dplyr::filter(n > 1L)| 2016 | 2017 | 2018 | 2019 | 2020 | 2021 | 2022 | 2023 | |
|---|---|---|---|---|---|---|---|---|
| Typical Starter House | 6.4 | 6.05 | 8.66 | 9.6 | 10.08 | 11.63 | 18.89 | 7.23 |
| Typical Monthly Rental | 3.12 | 1.04 | 8.35 | 6.78 | 5.5 | 6.21 | 16.74 | 6.43 |
| Median Income | 1.52 | 3.8 | 3.29 | 3.16 | 3.21 | 8.7 | 9.58 | 5.01, NA |
New Housing
Between 2017 and 2022, Mesa County added a total of 5,578 new housing units. 85.4% of these units have been added in the urban areas of Mesa County.
NEW HOUSING UNITS BY TYPE MESA COUNTY 2017-2022
| Urban/Rural | Type | 2017 | 2018 | 2019 | 2020 | 2021 | 2022 | Row Totals |
|---|---|---|---|---|---|---|---|---|
| Rural | Single Family Residence | 105 | 117 | 120 | 168 | 188 | 112 | 810 |
| Urban | Single Family Residence | 542 | 600 | 521 | 560 | 645 | 493 | 3361 |
| Urban | Townhouse Unit | 73 | 92 | 79 | 66 | 114 | 50 | 474 |
| Urban | Duplex/Triplex Unit | 14 | 6 | 0 | 9 | 10 | 8 | 47 |
| Urban | Multi-Fam 4-8 Unit | 0 | 6 | 8 | 0 | 17 | 62 | 93 |
| Urban | Multi 9+ Unit | 20 | 49 | 45 | 299 | 217 | 163 | 793 |
| Total Units | All Units | 754 | 870 | 773 | 1102 | 1191 | 888 | 5578 |
Source: Mesa County Assessor Data Request
NEW HOUSING UNITS LOCATION 2017-2022


Rural Areas; Urban Areas; New housing
Source: Mesa County Assessor Data Request
Homelessness
Homelessness is a common concern and a high priority for intervention among Mesa County community members. Residents are increasingly experiencing homelessness and other types housing instability. Services for people experiencing homelessness are frequently beyond capacity, lacking adequate fiscal resources or staff to serve the increase in need.
Addressing homelessness in Mesa County will require:
- having the right stakeholders at the table,
- finding funding,
- providing data to show the scope and scale of the issue,
- advocating for policy change, and
- providing community education to enhance support for services and to reduce stigma.
The 2021 Grand Valley Housing Survey identified and quantified housing needs across the Grand Valley. The survey results informed strategy and recommendations for community leaders that can guide future policy decisions related to housing.
Here are some of the key findings from the survey:
- One in five households with income less than $35,000 would like to live on their own or with fewer people but cannot afford it.
- One in four households who had moved in the last five years did not wish to move but had to.
- Respondents expressed a strong desire for the housing stock to accommodate a wide range of residents including those living on a fixed income, low- and moderate-income families, and residents with mobility challenges.
In 2023, the City of Grand Junction and community partners conducted an Unhoused Needs Assessment that aimed to identify strategies and actions to address needs among residents experiencing housing insecurity. The assessment estimates that at the time of publication, there were 2,300 individuals experiencing homelessness in the Grand Junction area.
 Additional Resources
Resident Priorities & Concerns
Housing Options & Availability
Affordable housing and a diversity of housing options are priorities for residents in Mesa County. In the 2022 Tell Us Community Survey, one in four residents identified the facilitation of diverse housing development as a priority for county leadership.
While the great majority of Mesa County residents feel there is not enough affordable housing, this is even more pronounced among younger adults who are often entering the market as first-time homebuyers. Only 7% of residents under 40 said they were satisfied with affordable housing availability.
This sentiment was reflected in the 2022 Mesa County Master Plan survey as well. A significant majority of residents, nearly three in four, said there were too few starter homes available, and about half said there are too few apartments and too little housing for seniors. By contrast, 97% of residents said there are enough or too many higher-end homes available.
Dissatisfaction with housing availability (2022), “Mesa County has too few …”
Dissatisfaction with housing availability (2022), “Mesa County has too few …”
| Starter Homes | Apartments | Housing for Seniors | Townhomes/Condos | Mobile Homes | Higher-end Homes |
|---|---|---|---|---|---|
| 73.0% | 51.0% | 50.0% | 43.0% | 9.0% | 3.0% |
Source: 2022 MESA COUNTY MASTER PLAN SURVEY
Urban Expansion
Though residents share broad consensus that housing availability in Mesa County is inadequate in various ways, on the whole they also prefer limiting housing expansion primarily to urban areas.
According to the 2022 Mesa County Master Plan survey, the quality of the natural environment and outdoor recreation are some of the most highly rated and valued characteristics of life in Mesa County, and the vast majority of residents want these to be protected for the future. The majority of residents agreed that rural areas should remain rural and that new development should minimize impacts to natural areas and agricultural land.
While there is wide support for limiting expansion into rural areas, this type of expansion could be useful in helping to resolve existing housing issues. Local governments will need to incorporate a balance of both of these resident priorities as they work to address housing access throughout the county.
Resident’s Agreement with the statment …
Mesa County. Mesa County Master Plan Survey. 2022.
Food Access
According to research by Feeding America, in 2021, 11.1% of Mesa County’s population was likely experiencing food insecurity, based on economic and demographic factors. That equates to approximately 17,000 individuals. Within that group, one in four likely met criteria for food assistance such as SNAP and WIC, but three in four likely did not due to earning above the income limits for eligibility.
In the 2023-2024 school year, 53% of Mesa County students attending a local district qualified for free or reduced lunch. Since this is an opt-in, income-based qualification, it likely does not fully capture students whose families are struggling with economic self-sufficiency, and may experience food insecurity.
In District 51’s 2023 Panorama student survey, 93% of 3rd to 5th grade students and 97% of 6th to 12th grade students indicated that they have enough food at home to eat breakfast, lunch, and dinner.
In the 2023 Colorado Health Access Survey, 8.4% of Mesa County residents indicated that in the past 12 months, they had eaten less than they felt they should because there wasn’t enough money for food. Statistically, this rate is similar to the 2021 rate of 8.8% and the 2019 rate of 9.2%, though it is possible that it reflects the beginning of a downward trend that would be more clear with additional data.
RESIDENTS WITH FOOD INSECURITY, MESA COUNTY

RESIDENTS WITH FOOD INSECURITY, MESA COUNTY
| Year | Percent with food insecurity |
|---|---|
| 2019 | 9.2 |
| 2020 | 8.8 |
| 2021 | 8.4 |
Source: Colorado Health Access Survey
 Healthy School Meals for All
Following a successful ballot initiative, Colorado launched the Healthy School Meals for All program in Fall of 2023, providing free school meals for all participating Colorado schools, including Mesa County schools.
Statewide, school breakfast consumption is up 35%, and school lunch consumption is up 31%, with Colorado schools serving 184,000 breakfasts and 435,000 lunches each day.
Food insecurity is highly impacted by access to nutritious food. In urban areas, marked gray in the map below, target benchmarks for distance from homes to a grocery store that provides staple foods and fresh fruits and vegetables range from one mile to two miles. Clearly, there are urban areas of Mesa County that fall outside both of these benchmarks.
Access to neighborhood amenities like grocery stores is more important for low-income residents than moderate- and high-income residents. Some communities outside the radius may feel the lack of a nearby grocery store more acutely based on their economic resources.
 What the Community Said
- 59% of Mesa County residents were satisfied with their access to grocery stores in the area where they live. This was fairly consistent across age and income level.
- Fruita residents were less satisfied with their access to grocery stores with only 42% of residents being satisfied.
Source: Mesa County Tell Us Community Survey, 2022
MESA COUNTY ACCESS TO GROCERY STORES, 2023

Distance to Grocery Store
In rural areas, the generally agreed benchmark for distance to a grocery store is 10 miles. While much of Mesa County’s population meets this criteria, some communities or rural residences are farther than 10 miles and may find this distance is a barrier to accessing healthy food.

Distance To Grocery Stores: 1 mile radius; 2 mile radius; 10 mile radius
Source: Google Maps
Additional Resources
For more information on food insecurity and the efforts to reduce in Mesa County see the Mesa County Hunger Alliance’s Blueprint to End Hunger.
Information Access
Libraries
Mesa County Libraries provides a variety of physical and digital resources to Mesa County residents through their eight branches and website. In 2023, Mesa County Libraries circulated 1.3 million items. Computer use increased from 51,000 users in 2022 to 51,530 users in 2023 and wireless use increased from 375,000 to 379,000 sessions.
Mesa County Libraries
In addition, the library provides services and programming to enrich and support the community. One example is the Adult Learning Center at Mesa County Libraries, which offers 5 types of classes:
- English as a Second Language (ESL)
- GED Prep
- Career Online High School for Adults 19+ without a diploma
- Citizenship
- Adult Literacy
High-Speed Internet Access
Internet access influences a person’s opportunities in education, employment, and healthcare access. The most common barriers to internet access are infrastructure and affordability, barriers that most impact rural and low-income households.
According to the Census American Community Survey, in 2022, 10% of Mesa County households did not have a subscription to broadband internet services, which was similar to the statewide rate. Among Mesa County households with less than $20,000 in household income, 27% did not have a subscription to broadband internet services, compared to 31% in that income group nationally. This disparity is commonly referred to as the “digital divide” and has the potential to worsen pre-existing inequities.
In the 2022 Tell Us Community Survey, about 70% of respondents indicated they had adequate home internet access. Nonetheless, over 80% of residents support Mesa County leadership investing in better internet services and bringing more internet providers to the area.
Public Safety
A wide range of local agencies provide public safety in the Mesa County community, including law enforcement, fire and emergency services (EMS), code compliance, and more. The capacity and effectiveness of Mesa County’s public safety infrastructure is critical in mitigating the impacts of crime, unsafe or illegal land use, and other physical hazards and crises. Overall, the majority of Mesa County residents value this effort as highly important and put a great deal of trust in these institutions.
 Public Safety Prioity
Public safety was the second highest priority residents asked county leaders to focus on in the 2022 Tell Us Community Survey.
Law Enforcement and Emergency Response
Public safety is a top priority for residents in Mesa County. In the 2022 Tell Us Community Survey, 38% of residents identified promoting public safety as an area they’d prefer for community leaders to prioritize. This was the second most commonly selected priority after improving the K-12 education system.
Crime Rate Decrease
Mesa County property crime and violent crime dropped between 2019 and 2023.
Source: Colorado Uniform Crime Reporting
Across the county, half of residents indicated they are satisfied with the responsiveness of local law enforcement in the area in which they live, and a similar share said they personally trust law enforcement in Mesa County.
Residents’ satisfaction with law enforcement is a notable factor in how safe residents feel. Overall, about 47% of residents said they feel safe in the area where they live. However, this was dramatically higher among residents who were satisfied with the responsiveness of law enforcement in their area. Among residents who said they were satisfied with law enforcement responsiveness, 67% said they felt safe and secure, compared to only 25% among those who were less than satisfied.
SAFETY AND LAW ENFORCEMENT RESPONSIVENESS (2022)
Satisfied with law enforcement responsiveness when feeling safe

SAFETY AND LAW ENFORCEMENT RESPONSIVENESS (2022)
Satisfied with law enforcement responsiveness when feeling safe
| Yes | No | |
|---|---|---|
| When feel safe | 67 | 25 |
| When don’t feel safe | 33 | 75 |
Source: Mesa County Tell Us Community Survey, 2022
Since 2021, response times by law enforcement and Fire and EMS to emergency calls have decreased.
Rural Effects
Since Mesa County has large, sparsely populated rural areas, a call from a distant point of the county can notably shift the average up.
Priority 1 (emergency) average response times, all Mesa County jurisdictions
| 2021 | 2022 | 2023 | |
|---|---|---|---|
| Law Enforcement | 14 min 38 sec | 14 min 36 sec | 13 min 43 sec |
| Fire/EMS | 9 min 47 sec | 9 min 0 sec | 8 min 54 sec |
Source: Mesa County Sherrif’S Office, Data Request, 2023
Across Mesa County, there were 243 violent crimes in 2019 and 196 in 2023, a decrease of 19%. This is particularly notable because across the state, violent crimes increased by 21.4% over the same time period.
Mesa County also significantly surpassed the state’s clearance rate. In 2023, 42.8% of violent crimes were cleared statewide, compared to 68.4% in Mesa County.
Defintion: Cleared
A case is considered cleared when three specific conditions have been met. At least one person has been:
- Arrested.
- Charged with the commission of the offense.
- Turned over to the court for prosecution.
Property crime rates increased from 2019 to 2021, but dropped significantly in 2022 and remained low in 2023.
PROPERTY CRIME RATE PER 1,000 PEOPLE

Property crime rate per 1,000 people
| Region | 2019 | 2020 | 2021 | 2022 | 2023 |
|---|---|---|---|---|---|
| Mesa | 27.0 | 31.8 | 30.3 | 23.4 | 23.4 |
| Colorado | 29.8 | 33.5 | 38.3 | 35.3 | 32.6 |
Source: Colorado Uniform Crime Reporting
VIOLENT CRIME RATE PER 1,000 PEOPLE
Violent crime rate per 1,000 people
| Region | 2019 | 2020 | 2021 | 2022 | 2023 |
|---|---|---|---|---|---|
| Mesa | 1.6 | 1.7 | 1.8 | 1.1 | 1.2 |
| Colorado | 4.4 | 4.8 | 5.4 | 5.5 | 5.2 |
Source: Colorado Uniform Crime Reporting
Code Compliance
In Mesa County, code compliance is handled by city and county offices. The goal of code enforcement agencies is to maintain and improve the safety and aesthetic appearance of Mesa County neighborhoods. Code compliance teams accomplish this goal by supporting residents and holding them accountable for removing health and safety hazards from their properties. This intervention impacts a neighborhood beyond the immediate removal by reducing crime and improving connectedness between neighbors.
Mesa County Code Compliance works in all of unincorporated Mesa County. This means they serve a mix of urban communities like Clifton and Orchard Mesa and rural communities like Whitewater, Loma, and Mesa.
Some of the approaches Mesa County Code Compliance uses include community clean ups, landfill passes, and responding to complaints of code violations.
 Mesa County Community Cleanups
- 2023
- 1,800 residents served
- 264 tons removed (county and city partnership)
- 2022
- 4,500 residents served
- 343 tons removed
- 2021
- 209 tons removed
- 2019
- 2,000 residents served
- 140 tons removed
Source: Mesa County Code Compliance Data Request
Over the past five years, Mesa County has sought a balance of efficient use of funds and effective intervention. Maintaining this balance depends on community engagement, funding opportunities, and staffing levels.
Environmental Health and Safety
Environmental health and safety describes the air we breathe, the water we drink, the food we eat, and the potentially harmful things our bodies are exposed to.
Radon
More Radon
Radon is the number one cause of lung cancer among non- smokers. Radon is responsible for about 21,000 lung cancer deaths every year.” -Environmental Protection Agency
More Info
More information on Radon In Colorado is available from CDPHE.
Radon is a naturally occurring colorless and odorless radioactive gas that is generated in the soil from the decay of trace amounts of uranium-238 and thorium-232. Radon was first identified as a hazard in the mid 1980s. Radon has been found in every U.S. state, and 30 states have average test levels higher than the level deemed safe by the Environmental Protection Agency.
Radon is found in all buildings but tends to concentrate at the lowest levels of a building such as basements and crawl spaces. It is more concentrated in houses that have higher levels of air sealing. Testing for radon should be done in the lowest occupiable level of a building.
The action level for radon in Colorado is 4 pCI/L. In Colorado in 2022, 48.3% of pre-mitigation home radon tests were above the limit. In Mesa County, 34.0% of the tests were above the limit. Location within Mesa County greatly affects the radon levels in homes. The percent of pre-mitigation radon tests above the action level ranges from 9% to 65% in Mesa County based on census tract.
Radon testing is voluntary and usually performed by the homeowner or a home inspector. Radon mitigation requires drilling through a building’s foundation and venting off-gassed radon with a series of powered fans. The cost of the mitigation can vary based on the building’s construction, but mitigation for a single-family home can cost $1,300 or more.
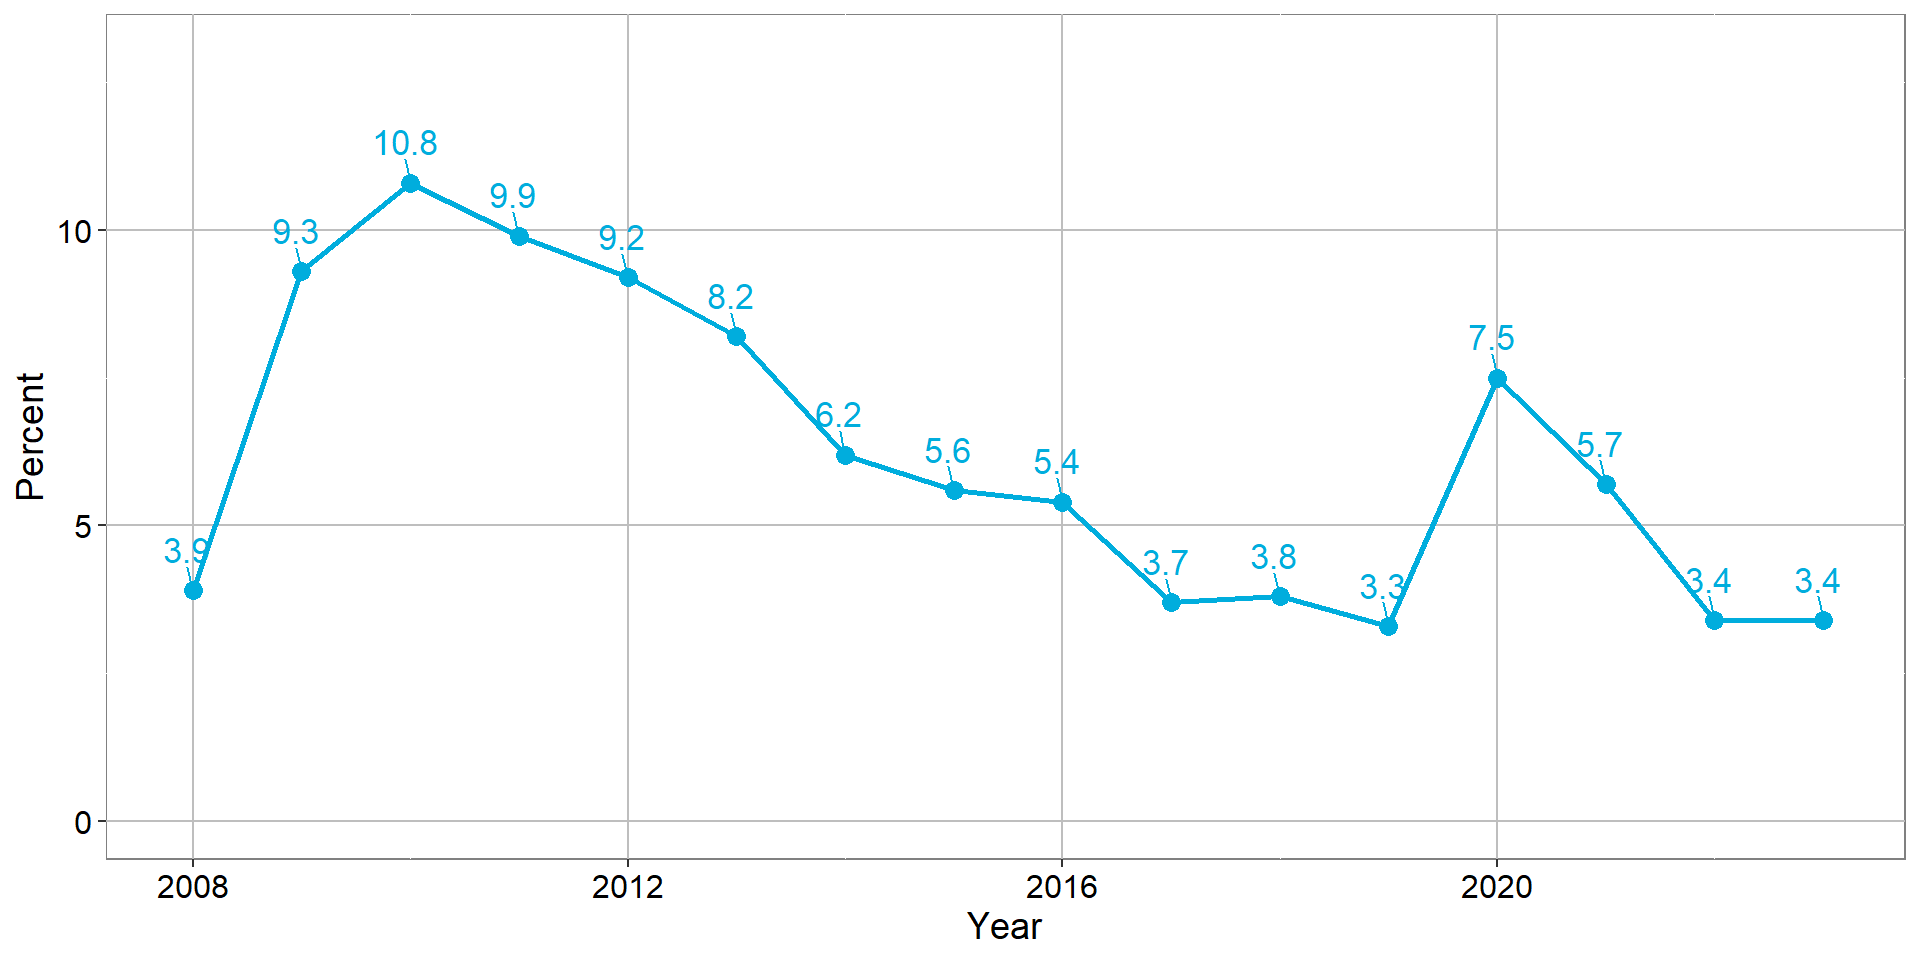
Percent of radon home tests above colorado’s action level, Mesa County (2005-2022)
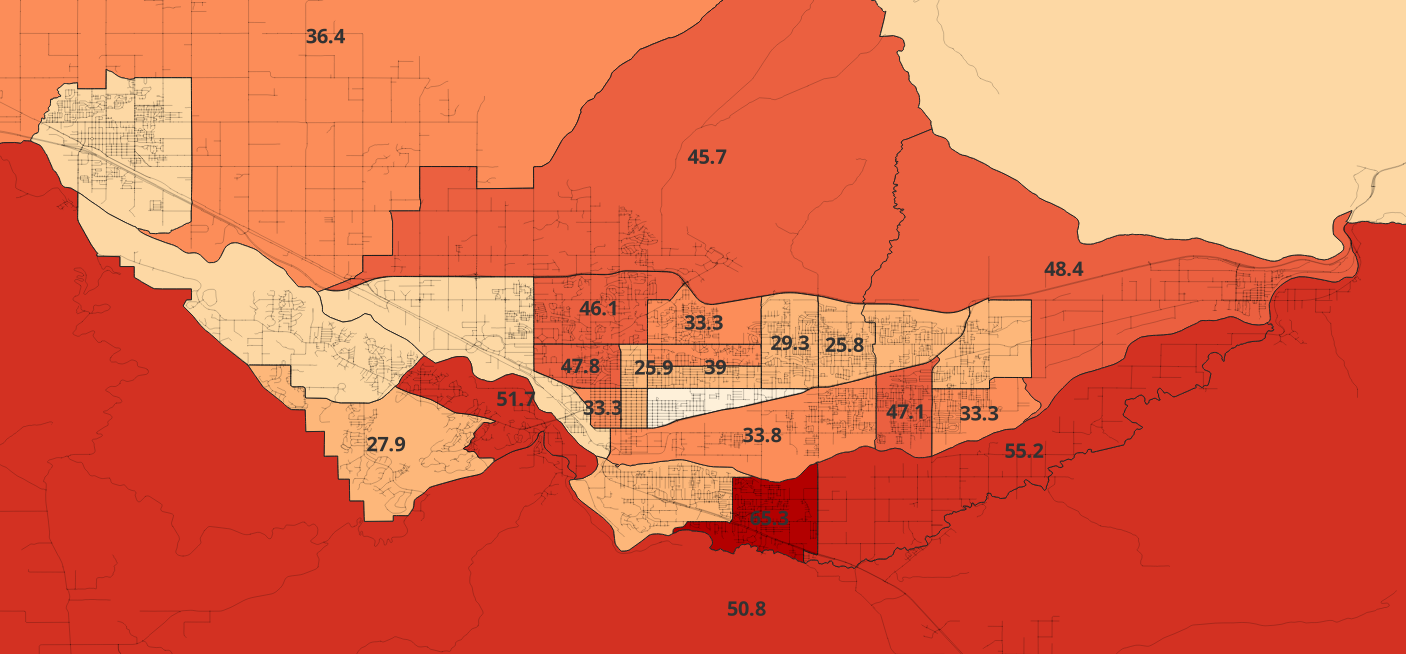
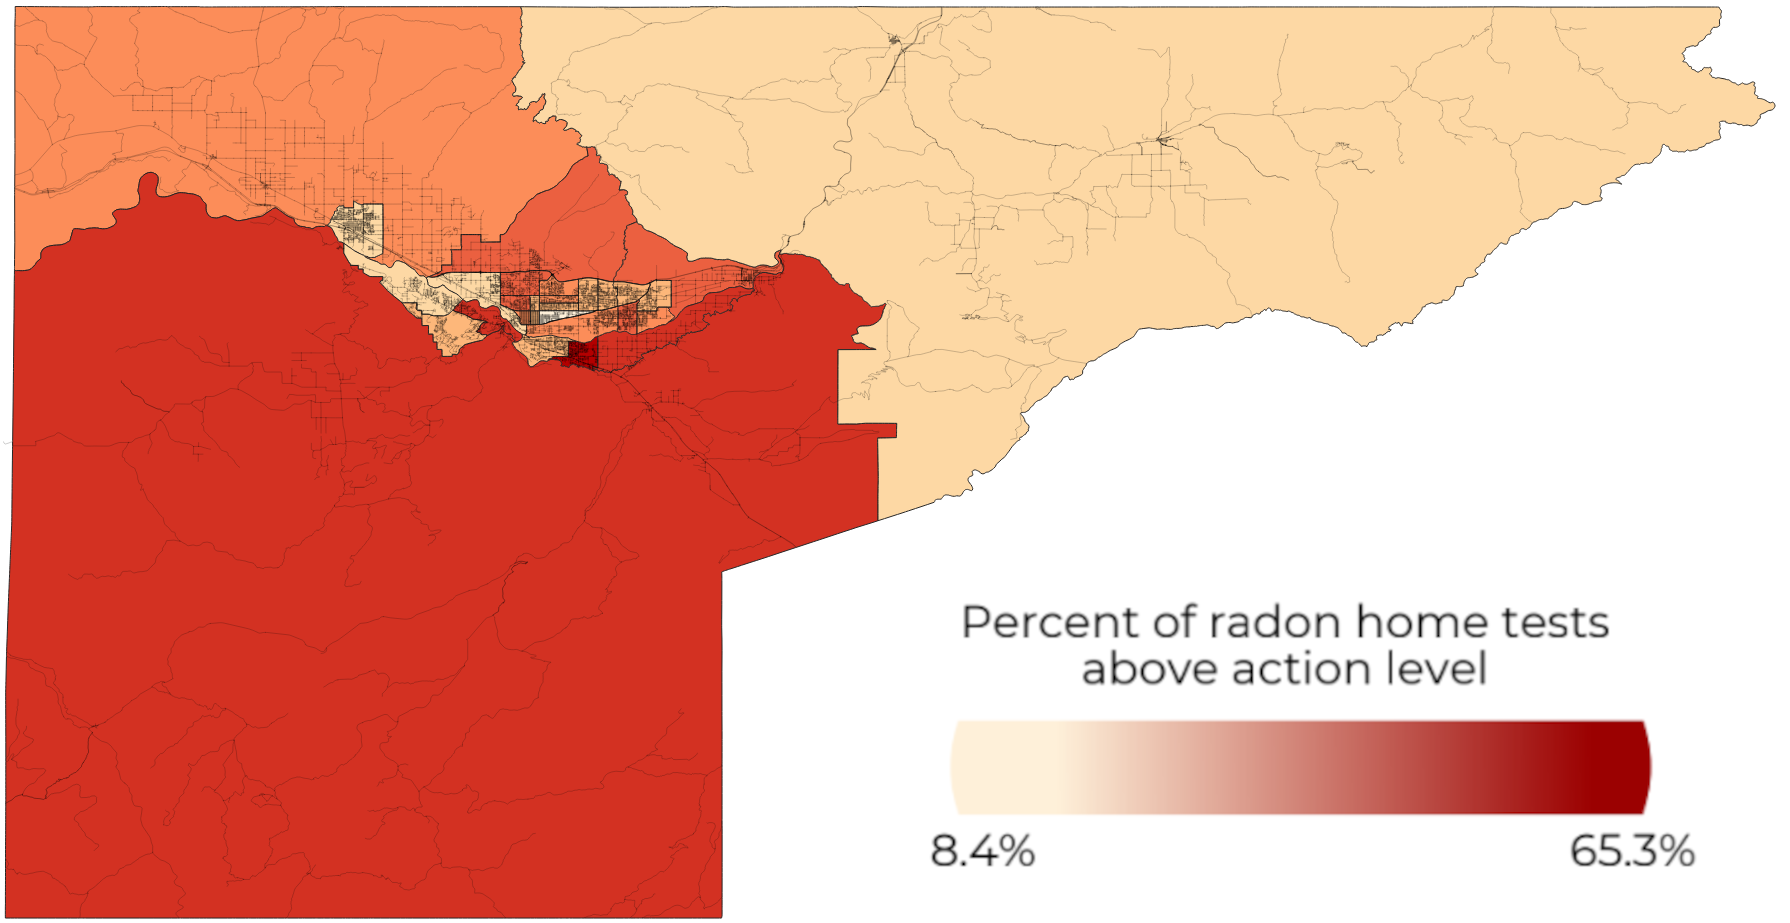
Urban view (top) rural view (bottom) of percent of radon home tests above Colorado’S 4pcl/L Action Level (2005-2022) The darker color the higher the percentage of radon home tests above the 4pCI/L action level. Regions with a percentage above 25% are labeled in the urban view.
Water Quality
Water Testing
- More information on drinking water quality can be found at the CDPHE Drinking Water website.
- A map of test results by county can be viewed here
Mesa County Public Health’s water quality lab provides testing services for the Western Slope. Between 2021 and 2023, the MCPH Water Quality lab processed 10,863 samples from 17 counties in Colorado. The MCPH lab tests for coliform bacteria, which must be completed several times per year. Without the local lab, samples from the Western Slope would be sent to labs several hours away for analysis, adding time and expense.
In 2022, CDPHE tested various Mesa County drinking water sources that in total serve over 60,000 residents. All sites were below acceptable thresholds for the eleven contaminants, indicating that they were safe to drink.
Drinking Water Contaminants
Types of drinking water contaminants:
- Arsenic
- Atrazine
- Di-(2-Ethylhexyl) phthalate (DEHP)
- Nitrate
- Perchloroethylene (PCE)
- Radium
- Haloacetic acids (HAA5)
- Trihalomethanes (TTHM)
- Trichloroethylene (TCE)
- Uranium
- Polyfluoroalkyl substances (PFAS)
Air Quality
Air quality is an increasingly important issue to local residents. This is especially true when the air is conspicuously smoky during the intensifying wildfire seasons across the western United States and agricultural burn seasons within the Grand Valley.
Mesa County has two main pollutants that cause unhealthy air quality, ozone and particulate matter.
Health Effects
Particulate Matter
The size of particles is directly linked to their potential for causing health problems. Small particles less than 10 micrometers in diameter pose the greatest problems, because they can get deep into your lungs, and some may even get into your bloodstream. Exposure to such particles can affect both your lungs and your heart. Numerous scientific studies have linked particle pollution exposure to a variety of problems, including:
- premature death in people with heart or lung disease
- nonfatal heart attacks
- irregular heartbeat
- aggravated asthma
- decreased lung function
- increased respiratory symptoms, such as irritation of the airways, coughing or difficulty breathing.
People with heart or lung diseases, children, and older adults are the most likely to be affected by particle pollution exposure.
Source: Particulate Matter Pollution
Ozone is formed from two non-visible pollutants:
- nitrogen oxides (NOx) commonly emitted from vehicles and power plants, and
- volatile organic compounds (VOCs) emitted from vehicles, factories, gas stations, and paints.
When these components combine with sunlight, the product becomes visible as smog.
In addition to ozone, the other common pollutant is particulate matter. Particulate matter can be made up of particles emitted from construction sites, unpaved roads, fires, and dust from wind. Particulate matter can also be made of chemical pollutants emitted from power plants, industries, and automobiles.
2020
Note that in 2020 there were more air quality days worse than moderate which resulted from increased wildfires in the Western U.S. and in the local area.
The size of particles is directly linked to their potential for causing health problems. Small particles less than 10 micrometers in diameter pose the greatest problems. They can get deep into the lungs, and some may even get into the bloodstream. Exposure to such particles can affect both the lungs and the heart.
People with heart or lung diseases, children, and older adults are the most likely to be affected by particle pollution exposure.
As overall air quality degrades, those with lung-related health issues like asthma or chronic obstructive pulmonary disease (COPD) will be affected sooner than others.
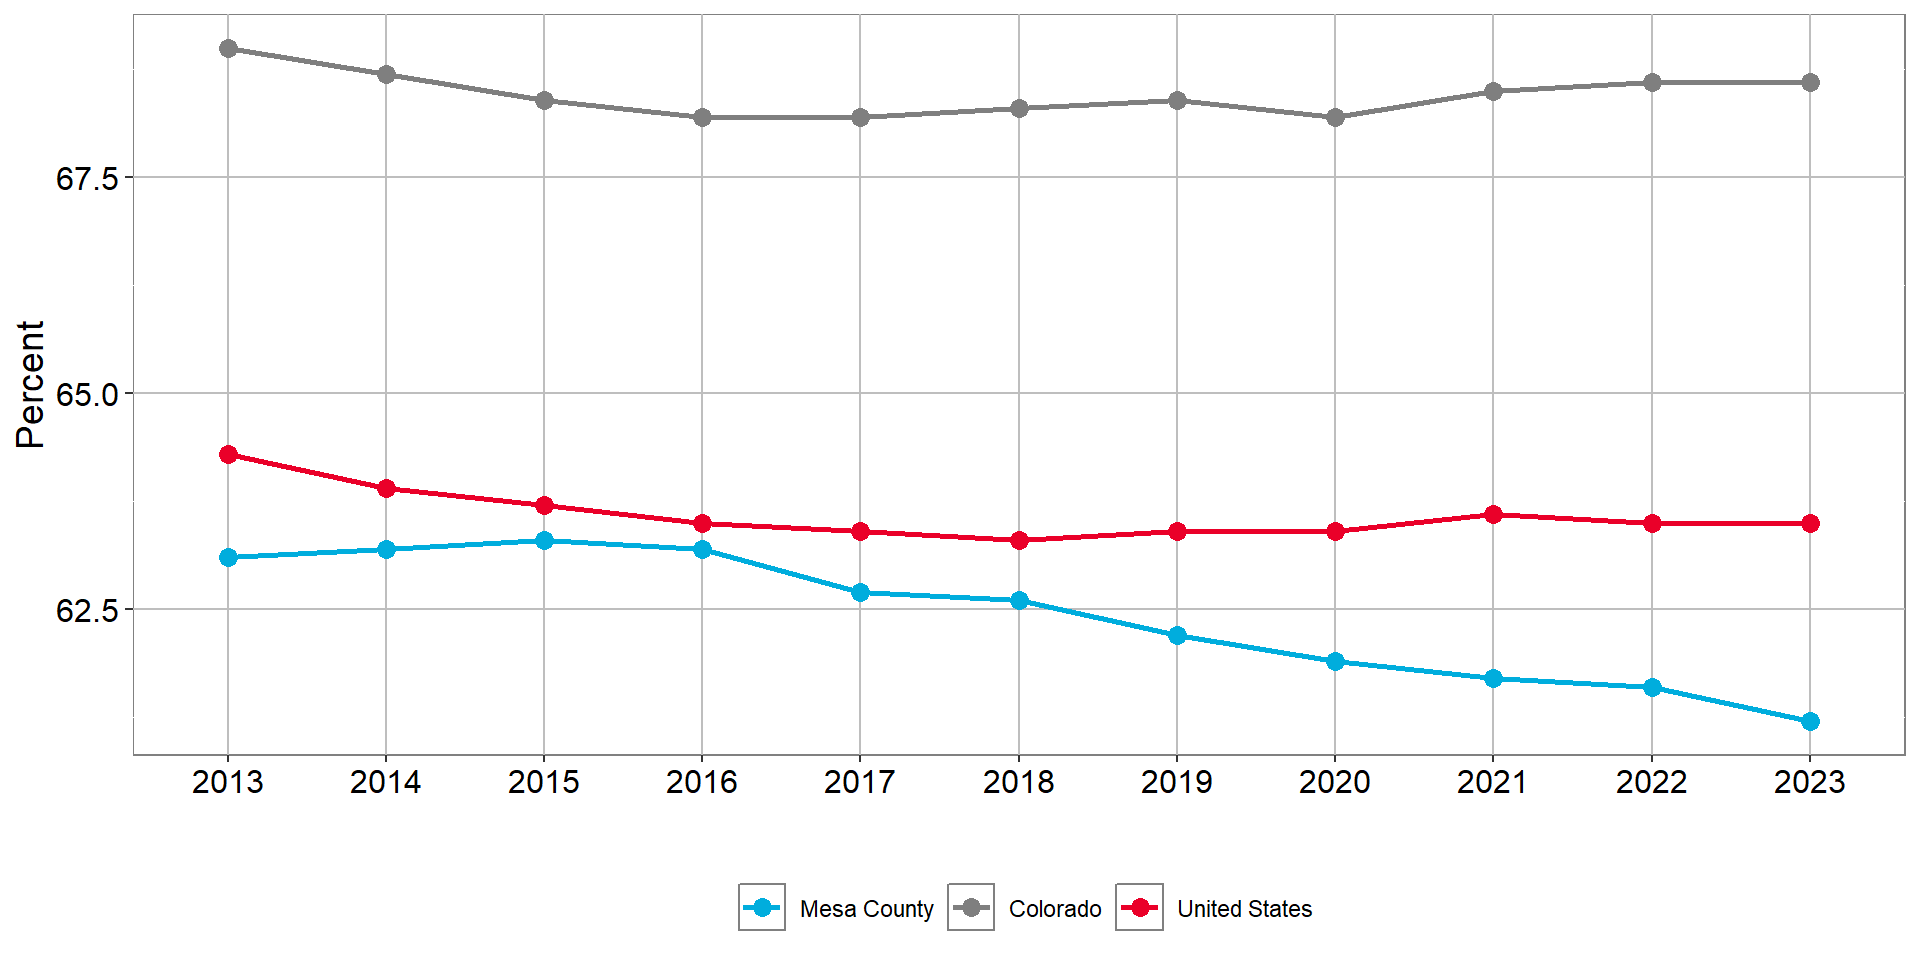
Mesa County has had very few days in recent years where air quality was unhealthy for the general population. Even for sensitive individuals only 1.1% of the days in the last three years would have been of concern. However, for those who are sensitive those days can be very stressful.
More information
- Data from official EPA sensors located in Grand Junction from the Air Quality System API.
- For techincal data on air quality click here
Air quality days 2013 to 2023


Air quality days 2013 to 2023
| Year | 2013 | 2014 | 2015 | 2016 | 2017 | 2018 | 2019 | 2020 | 2021 | 2022 | 2023 |
| Good | 206 | 141 | 135 | 162 | 137 | 125 | 264 | 196 | 168 | 183 | 171 |
| Moderate | 153 | 211 | 211 | 194 | 226 | 232 | 100 | 157 | 193 | 177 | 191 |
| Unhealthy for Sensitive Groups | 5 | 12 | 18 | 9 | 2 | 7 | 1 | 12 | 2 | 5 | 3 |
| Unhealthy | 1 | 1 | 1 | 1 | 0 | 1 | 0 | 1 | 2 | 0 | 0 |
Since 2017 there has been a slight increasing trend in the number of “Good” air quality days; however, local area wildfires can produce clusters of days where the air quality becomes unhealthy for sensitive groups or worse.
Air Quality
Air quality from 2021-2023, percent of days that were:
- Good: 47.7%
- Moderate: 51.2%
- Worst than Moderate: 1.1%
- Moderate or worst do to ozone alone: 19.1%
- Moderate or worst do to particulate matter alone (PM2.5 or PM10): 28%
Only 16.7% days of moderate or worse air quality occurred during the county’s official burn season, March 1 to May 31 and Sept 1 to October 31. Agricultural burning may occur at any time of the year.
Days of Moderate or Worst by month
Days of Worst than Moderate by Month
Moderate or Worst Air Quality by Month
| Season | 1 | 2 | 3 | 4 | 5 | 6 | 7 | 8 | 9 | 10 | 11 | 12 |
|---|---|---|---|---|---|---|---|---|---|---|---|---|
| Off Season | 5.8 | 3.4 | 5.8 | 5.8 | 4.7 | 4.9 | 5.4 | |||||
| Burn Season | 1.9 | 3.3 | 5.4 | 3.7 | 2.5 |
Worst than Moderate Air Quality by Month
| Season | 1 | 2 | 3 | 4 | 5 | 6 | 7 | 8 | 9 | 10 | 11 | 12 |
|---|---|---|---|---|---|---|---|---|---|---|---|---|
| Off Season | 0.5 | 0 | 0 | 0 | 0.2 | 0.1 | 0.1 | |||||
| Burn Season | 0 | 0.3 | 0 | 0 | 0 |
Source: EPA Air Quality System API
Purple Air
To explore real time air quality monitoring see Purple Air’s realtime dashboard map
PurpleAir offers a realtime dashboard map that shows many sensors across Mesa County in urban and rural areas —some purchased by county and local governments, and some purchased by community members. While their testing methods are different from the standard sensors used to record air quality, they paint an important picture of the variation in air quality across Mesa County.
Retail Food inspections
Inspections Pass Rate
89% of Mesa County restaurants passed their routine inspection on the first try.
Mesa County has approximately 750 retail food establishments. Between 2021 and 2023, MCPH completed 1,594 retail food inspections, 1,008 of which were routine inspections.
Routine inspections resulted in 898 passing outcomes, 107 re-inspections, and three closures. MCPH conducted 115 inspections in response to a complaint.
Inspections are conducted on a risk-based schedule. Most full-service restaurants are inspected one time per year as long as they successfully pass the routine inspection. If they require reinspection, they are subsequently inspected more frequently.
In addition, MCPH provides licenses for approximately 100 food vendors at over 50 special events throughout the year.
Transportation
Transportation Satisfaction
Residents who were satisfied with:
- 49% bikeability
- 44% walkability
- 28% road conditions
In the 2022 Tell Us Community Survey, 31% of residents identified improving transportation infrastructure as a top priority for county leadership. Residents living in urban areas were more likely to select transportation infrastructure as a priority in future planning, 33% of urban residents compared to 24% of rural.
Fruita residents were notably more satisfied with transportation options in their area. 71% of Fruita residents were satisfied with bikeability, compared to 47% living elsewhere. 66% of Fruita residents were satisfied with walkability compared to 42% of residents living elsewhere in the county.
19% of Clifton residents were satisfied with road conditions, compared to 29% of residents living elsewhere. Since the survey was completed, several major roadwork projects have been undertaken in the Clifton area.
County Master Plan Survey
Residents who think the following actions should be a priority in improving transportation in Mesa County:
- Improved maintenance of streets - 69%
- Better management of traffic flow on major roads - 60%
- Increasing the availability of walking paths and biking trails - 53%
- Increasing the availability and quality of sidewalks - 54%
In Mesa County, a serious injury crash occurs approximately every five days and a fatal crash happens approximately every 21 days. Speeding was a factor in 44% of rural fatal and serious injury crashes and 22% of urban fatal and serious injury crashes. Impairment is a factor in 22% of rural fatal and serious injury crashes and 23% of urban fatal and serious injury crashes.
594 people lost their lives or were seriously injured on Mesa County roads between 2016 and 2022. Thousands more were impacted by crashes.
Over this time period, a serious injury crash occurred approximately every five days, and a fatal crash happened approximately every 21 days.
Speeding was a factor in 44% of rural fatal and serious injury crashes and 22% of urban fatal and serious injury crashes.
More Information
The Mesa County Safety Action Plan aims to identify solutions to reduce the number of deaths and serious injuries on our roads. The plan will be adopted in Fall 2024 and will cover the entirety of Mesa County, including the cities of Grand Junction and Fruita and the towns of Palisade, Collbran, and De Beque.
For more information see www.mesacountysafetyactionplan.com.
Impairment was a factor in 22% of rural fatal and serious injury crashes and 23% of urban fatal and serious injury crashes.
CRASHES WITH A FATALITY OR SERIOUS INJURY, MESA COUNTY (2016-2022)
![]()
![]()
Urban view (top) and full county view (bottom)
Source: Regional Transportation Planning Office
Parks and Green Space
Mesa County is unique in the abundance of outdoor recreation opportunities available to residents, both in urban areas and throughout a wealth of rural public lands. Parks and green space hold tremendous power for improving physical, mental, and environmental health. Particularly among urban residents, parks offer natural spaces for increased physical activity and social connections, as well as protecting against urban environmental health threats such as air and noise pollution.
Parks
The City of Grand Junction has 43 parks including 35 developed parks, 3 undeveloped parks, and 5 school parks that are available to the public. Most parks offer a variety of amenities including open space, playgrounds, dog parks, and skate parks.
The City of Fruita maintains 11 neighborhood and community parks, over 270 acres of open space, and approximately 10 miles of hard- and soft-surface trails.
Outdoor recreation is an integral part of Mesa County culture, and 87% of residents use Mesa County parks and trails. The quality and number of parks and trails are among the highest rated community amenities.
By area, Mesa County is over 70% public land managed by the Bureau of Land Management and the U.S. Forest Service. Public lands include the Colorado National Monument and Grand Mesa National Forest. Mesa County public lands contain over 270 miles of non-motorized trails available for hiking, mountain biking, nordic and backcountry skiing, and horseback riding. Some of the more popular trail systems include Lunch Loops, North Fruita Desert 18 Road, Kokopelli, Palisade Rim, and Gunnison Bluffs.
New trails
In 2023, the Mesa County Trail Crew built three miles of new trails and maintained 50 miles of existing trails.
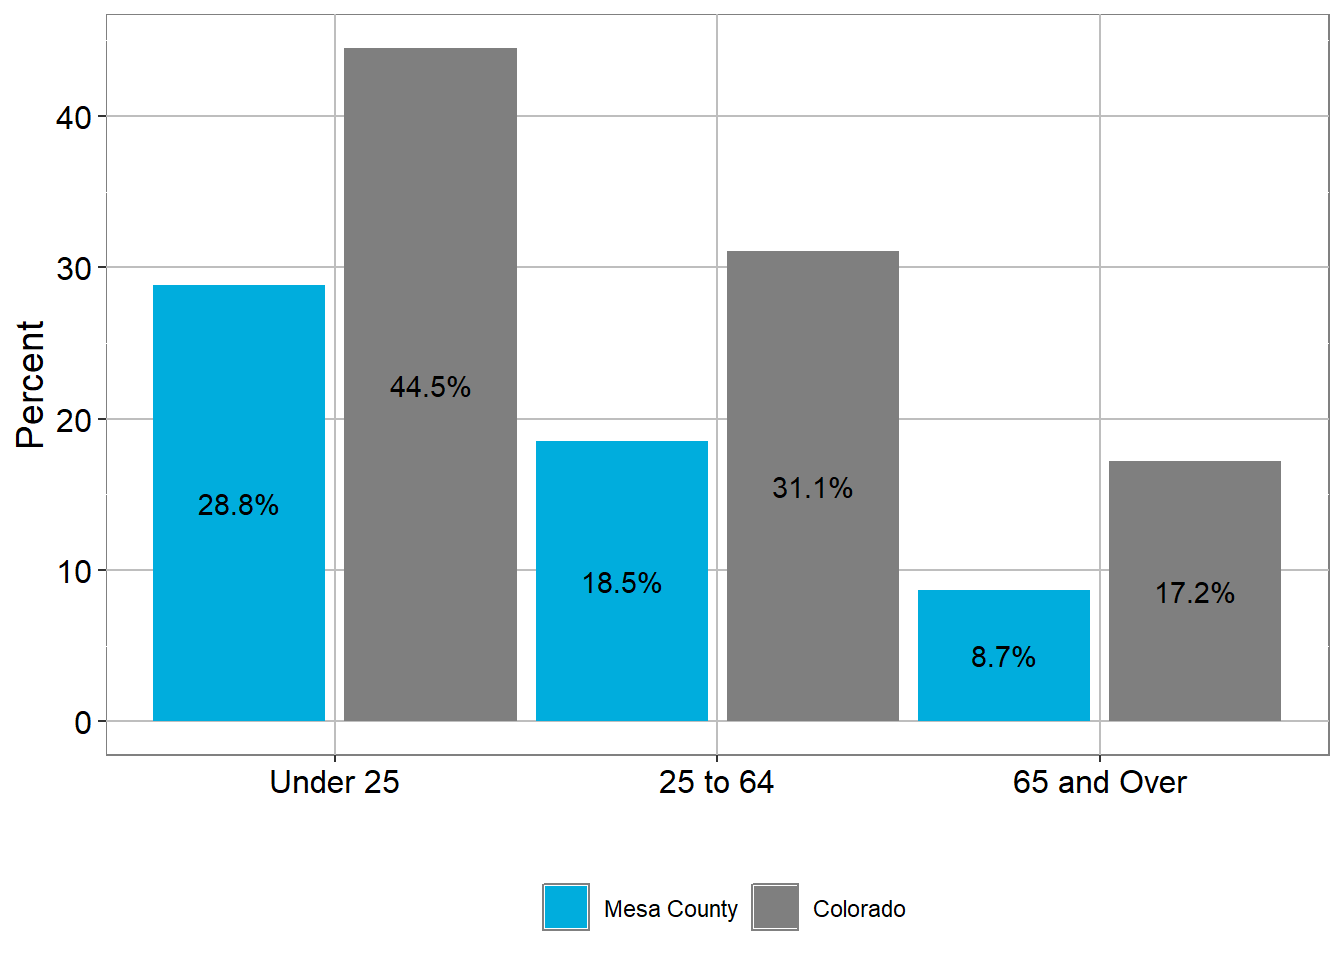
Park and trail usage is nearly ubiquitous among all ages of Mesa County residents but does decrease slightly with age. About 80% of adults over 60 report using parks and trails, compared to nearly all adults under 40. From the 2022 Tell Us Community Survey, outdoor recreation among older adults was notably correlated with higher satisfaction with quality of life and greater social connectedness. Older adults who use parks and trails are more likely to:
- agree that Mesa County is a good place to live,
- have more friends they stay in regular contact with, and
- say they feel close to their neighbors.
References
2.
3.
U.S. Census Bureau, American Community Survey 5-year estimates, Table: S0101; AGE AND SEX 2023
4.
USDA Rural Development. FY 2023 Rural Area Periodic Review. 2023
5.
Office of Disease Prevention and Health Promotion. Quality of Housing. Healthy People2030
6.
U.S. Census Bureau, American Community Survey 5-year estimates, Table: DP04; SELECTED HOUSING CHARACTERISTICS 2023
7.
8.
U.S. Census Bureau, American Community Survey 5-year estimates, Table: DP03.; SELECTED ECONOMIC CHARACTERISTICS 2023
9.
U.S. Census Bureau, American Community Survey 5-year estimates, Table: S2801; TYPES OF COMPUTERS AND INTERNET SUBSCRIPTIONS 2023
10.
Mesa County Assessor’s Office. New Housing Building Permit Data. 2017-2022. Data Request.
11.
City of Grand Junction. Grand Junction Area Unhoused Strategy. 2023.
12.
City of Grand Junction. Grand Valley Housing Needs Assessment. July, 2021.
13.
Mesa County. Mesa County Master Plan Survey. 2022. Data Request.
14.
Feeding America. Food Insecurity among the Overall Population in Mesa County. 2021
15.
Colorado Department of Education. 2023-24 PK-12 Free and Reduced Lunch Eligibility by District
16.
Mesa County Valley School District 51. Panorama Student Survey Responses, 2023-24. Data Request.
17.
CPR News, [Colorado’s free school meal program feeding more students than expected, creating a big gap in funding, February 2024](CPR News, Colorado’s free school meal program feeding more students than expected, creating a big gap in funding, February 2024
18.
Colorado Health Institute. Colorado Health Access Survey - Region 19. 2023. Data Request.
19.
Google Maps, Grocery Store Location Data, 2023
20.
Mesa County Hunger Alliance. Mesa County Blueprint to End Hunger. 2021.
21.
Mesa County Libraries. Annual Report. 2023.
22.
County Health Rankings & Roadmaps (2021). Broadband: A Super Determinant of Health
23.
U.S. Census Bureau, American Community Survey 5-year estimates, Table: S2801; - TYPES OF COMPUTERS AND INTERNET SUBSCRIPTIONS 2023
24.
Grand Junction Regional Comm Center. Priority 1 Average Response Times for Law Enforcement and Fire/EMS. 2021-2023. Personal Communication.
26.
Mesa County Code Compliance. Interview - Greg Moburg and Kelsie LeFevre. 2024.
27.
Colorado Environmental Public Health Tracking. Radon Data.
28.
Colorado Department of Public Health and Environment. Radon
29.
MCPH Environmental Health. Data request
30.
U.S. Environmental Protection Agency Air Quality System
31.
U.S. Environmental Protection Agency, Technical Assistance Document for the Reporting of Daily Air Quality – the Air Quality Index (AQI)
32.
Regional Transportation Planning Office. Mesa County Safety Action Plan
33.
County Health Rankings & Roadmaps (2023). Green Space & Parks
34.
City of Grand Junction Parks and Recreation. Parks
35.
City of Fruita Parks and Recreation. Parks and Trails Information
36.
Mesa County Public Health. Interview - Ross Mittelman. 2024.